Course Overview

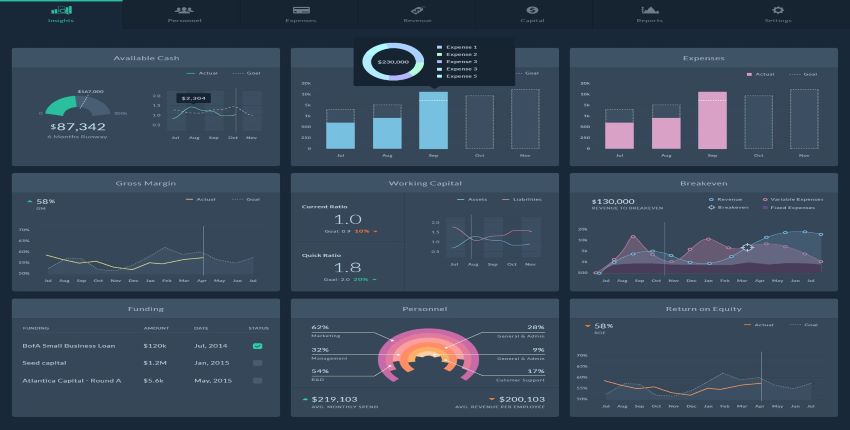
The program is a 12-week course designed to equip participants with the skills to analyze data, develop reporting dashboards, and create dynamic financial models for strategic decision-making. Participants will learn to leverage Advanced Excel functionalities to design interactive dashboards that summarize key financial metrics, track performance, and enhance data-driven insights.
Through hands-on exercises, real-world case studies, and industry best practices, the course covers data visualization techniques, financial storytelling, and dashboard automation. Ideal for finance professionals, FP&A analysts, business intelligence specialists, and corporate decision-makers, this program ensures that participants can transform complex financial data into clear, actionable insights that drive business value.
Find a programme
Certified Financial Reporting Expert Online36 days
-
00
DAY
-
00
HRS
-
00
MIN
-
00
SEC
Course Content

The course is structured over 12 weeks, with each week focusing on a specific aspect of building, designing, and optimizing dashboards and data visualization techniques in financial modelling. Participants will engage in a combination of theoretical learning, hands-on exercises, and real-world case studies to develop practical expertise. Weekly live sessions will provide opportunities for interactive learning, peer discussions, and direct feedback from instructors.
The detailed and comprehensive curriculum ensures that participants gain a deep understanding of data visualization principles and dashboard development, equipping them with the skills to apply these techniques effectively in their professional roles. The program allows participants to:
» Understand the fundamentals of data visualization and its role in financial decision-making.
» Learn the structure and key components of effective dashboards, including layout design, interactivity, and automation.
» Develop dynamic financial dashboards from scratch, utilizing Advanced Excel functionalities such as pivot tables, Power Query, and Power Pivot.
» Master techniques for presenting key financial metrics, including trend analysis, KPI tracking, and variance reporting.
» Gain expertise in integrating financial models with dashboards to improve forecasting accuracy and real-time financial monitoring.
» Learn advanced visualization techniques such as scenario analysis and sensitivity modeling for enhanced decision-making.
» Interpret dashboard insights and effectively communicate financial performance to stakeholders using storytelling techniques.
Find a programme
Certified Financial Reporting Expert Online36 days
-
00
DAY
-
00
HRS
-
00
MIN
-
00
SEC
Key Takeaways

By the end of this course, participants will be able to:
» Understand the fundamental principles and best practices of data visualization and dashboard development in financial modeling.
» Design and build interactive financial dashboards from scratch, incorporating key financial metrics and data visualization techniques.
» Utilize Advanced Excel functionalities such as pivot tables, Power Query, Power Pivot, and dynamic charts to create automated reporting dashboards.
» Analyze financial data effectively, extract key insights, and identify trends that impact business performance.
» Develop real-time financial dashboards that enable quick decision-making, KPI tracking, and variance analysis.
» Apply advanced visualization techniques, including scenario and sensitivity analysis, to enhance financial forecasting and risk assessment.
» Present financial findings clearly and effectively to stakeholders, using storytelling techniques and professional visual design principles.
Find a programme
Certified Financial Reporting Expert Online36 days
-
00
DAY
-
00
HRS
-
00
MIN
-
00
SEC
Target Audience

The following categories can register for the programme:
» Financial Directors, Managers, and Controllers looking to enhance financial reporting and decision-making through data visualization.
» Management Accountants and Financial Analysts aiming to develop dynamic dashboards for financial performance tracking and forecasting.
» Business Intelligence and Reporting Analysts seeking to refine their ability to present complex financial data in an intuitive and actionable format.
» Business and Project Analysts involved in creating dashboards and generating reports to support strategic decision-making.
» CEOs and Managing Directors who want to leverage data-driven insights for informed leadership and business growth.
» Investment and Corporate Bankers looking to enhance their financial modeling and data presentation skills.
» Professionals responsible for financial modeling and trend analysis who need to communicate key insights effectively through dashboards and reports.
Find a programme
Certified Financial Reporting Expert Online36 days
-
00
DAY
-
00
HRS
-
00
MIN
-
00
SEC
Register Now

Book your place
[everest_form id=”3084″]
Find a programme
Certified Financial Reporting Expert Online36 days
-
00
DAY
-
00
HRS
-
00
MIN
-
00
SEC


